

 SupplierX
 OrderX
 Xpense
 LogystiX
 ManufeX
 AeonXIQ



Building an AI-Powered Visual Inspection System on AWS with YOLOv11 and Amazon Bedrock
The Quality Intelligence Imperative: Why Manual Inspection Is a Manufacturing Risk
In high-volume manufacturing, quality inspection is one of the last processes to be digitally transformed — and often one of the most expensive when it isn't.
The reason manual inspection persists is understandable: it feels controllable. You can see the inspectors working, count the headcount, measure attendance. What you cannot easily measure is the inspection you missed on the 200th unit at the end of a shift, the subtle assembly defect that gets through because two inspectors interpreted the standard differently, or the batch-level failure that could have been caught at the individual unit level if your data had been structured enough to see the pattern forming.
When we engaged with an automotive component manufacturer facing these challenges, the gap between their inspection model and their quality outcomes was measurable and expensive: 82% inspection accuracy with 100% manual coverage, a defect escape rate that was generating warranty claims and OEM escalations, and no digital record of what had been inspected, when, or by whom.
The problem wasn't effort — the inspection team was working. The problem was that manual inspection at production speed is physiologically limited. Human attention degrades with volume, lighting variation, shift fatigue, and cognitive load. AI does not have those constraints.
This post documents how we designed and deployed a real-time AI-powered visual inspection platform for that manufacturer — combining YOLOv11 edge inference with Amazon Bedrock's generative intelligence and AWS IoT-based cloud ingestion to deliver what manual inspection could not: consistent, traceable, continuously improving quality coverage at full production speed.
As Technical Architect for this initiative at AeonX Digital, I led the architecture design, model strategy, and AWS service selection across the edge and cloud layers. What follows covers the implementation in enough detail to be useful to practitioners, along with the architectural decisions and trade-offs that shaped each choice.
The outcome: inspection accuracy increased from 82% to 97%, quality-related costs reduced by approximately 35% annually, and the manufacturer moved from sample-based inspection to full AI-driven coverage on every unit produced.
Why This Matters Now: The Edge AI Inflection Point in Manufacturing
Three forces are converging to make AI-powered inspection a mainstream manufacturing capability rather than a pilot project:
- Edge compute has reached production-grade reliability — NVIDIA Jetson AGX Orin and similar edge AI platforms now deliver inference speeds that match assembly line cycle times. The latency barrier that made cloud-only AI inspection impractical is gone. Inference happens at the device, in single-digit milliseconds, with no dependency on network connectivity for the primary quality decision.
- Computer vision models have matured for industrial use — Transfer learning from large pretrained models like YOLO architectures means that a manufacturer no longer needs tens of thousands of defect images to build a high-accuracy detector. Fine-tuning on a few thousand labeled images now produces production-grade accuracy in days, not months.
- Generative AI closes the gap between detection and action — Traditional computer vision tells you what it found. It doesn't tell you what to do about it. Amazon Bedrock converts detection outputs into plain-language summaries, corrective action recommendations, and trend narratives that a plant supervisor can act on without interpreting bounding boxes and confidence scores.
The decision to build this system was driven by a quality leadership team that recognized manual inspection was no longer scaling with production volume — and that the cost of escaped defects had begun to exceed the cost of building a better system.
The Business Problem
The manufacturer's existing inspection workflow had:
- 100% manual inspection with no structured defect criteria — consistent judgment depended entirely on individual inspector experience
- No real-time alerting — defect patterns were visible only in end-of-shift reports, after hundreds of units had already been produced
- No digital audit trail per unit — traceability for OEM compliance was manual and incomplete
- No predictive capability — root cause analysis happened after warranty claims, not before
- Sample-based documentation — only a fraction of inspected units had any recorded evidence
Business impact of the status quo:
- Rising rework costs from defects caught late in the production process
- OEM escalations and warranty claims from defects caught by customers
- Inability to scale inspection headcount proportionally with production volume increases
- Compliance exposure from incomplete traceability records
The goal was not to assist manual inspection — it was to replace it with a system that was faster, more consistent, and fully traceable, while keeping quality engineers in the loop as analysts rather than inspectors.
Technical Architecture: Edge + Cloud + GenAI
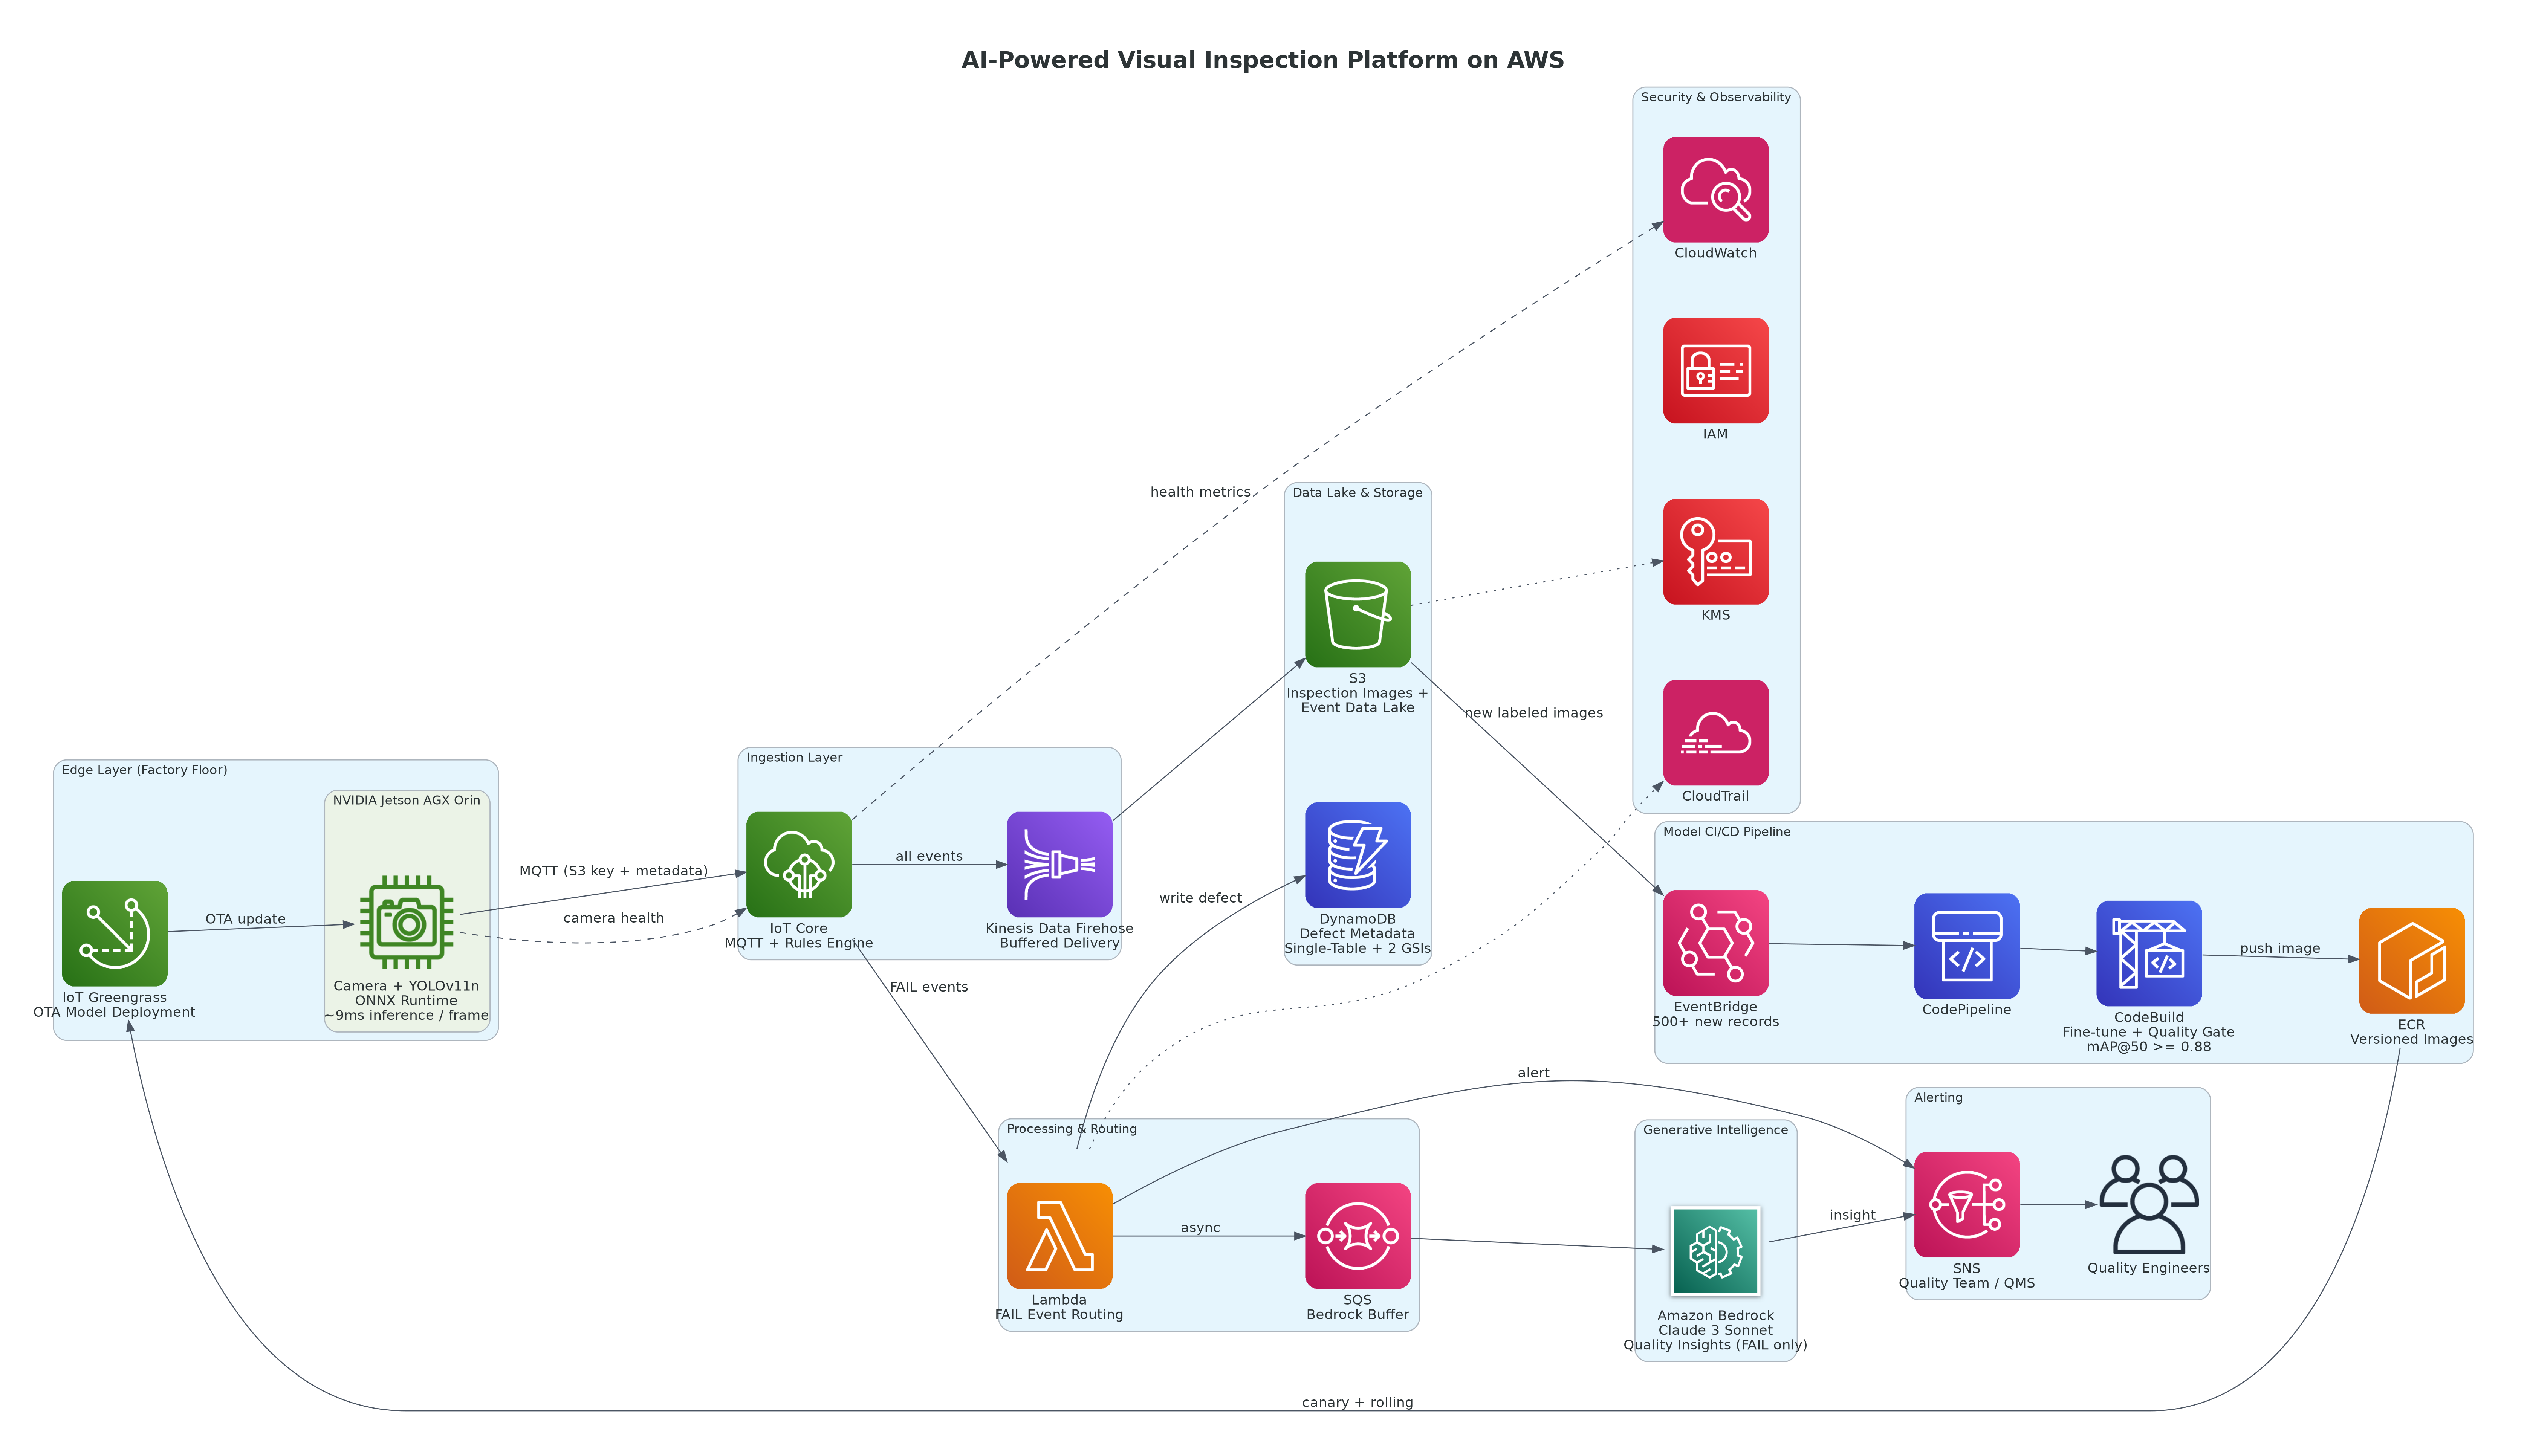
Figure 1: AI-Powered Visual Inspection Platform — Edge + Cloud + GenAI Reference Architecture
AWS and Technology Stack:
- YOLOv11n (Ultralytics) — custom-trained object detection models on NVIDIA Jetson AGX Orin edge devices
- ONNX Runtime — edge inference engine for runtime-agnostic deployment
- AWS IoT Core — secure MQTT ingestion from edge to cloud
- Amazon Kinesis Data Firehose — buffered delivery to S3 data lake
- Amazon S3 — inspection image and event data lake
- Amazon DynamoDB — structured defect metadata with single-table design
- Amazon Bedrock (Claude 3 Sonnet) — generative quality insights for FAIL events
- Amazon SNS — real-time alerting to quality teams and QMS
- AWS IoT Greengrass — OTA model deployment to edge devices
- AWS CodePipeline + Amazon ECR — automated model retraining and deployment pipeline
- Amazon CloudWatch and CloudTrail — observability and compliance audit
- AWS KMS and IAM — encryption and access control
The architecture combines three layers: edge inference for latency-critical pass/fail decisions, cloud data lake for analytics and model retraining, and generative AI for converting detections into actionable insights. Each layer was designed to be independently scalable and replaceable.
Key Architectural Decisions
Decision 1: Why Edge Inference Instead of Cloud Inference?
The first architectural question for any computer vision deployment in manufacturing is where inference runs. Cloud inference is simpler to operate — you push images to an API and get results back. The problem is latency.
At five units per minute on an assembly line, the maximum acceptable inspection-to-decision time is 180ms. A round-trip cloud API call — accounting for image upload, inference, and response — consistently exceeds 300–400ms under normal network conditions, and is completely unavailable during network interruptions.
Edge inference on NVIDIA Jetson AGX Orin with ONNX Runtime delivers 9ms per frame. That is not incremental improvement over cloud inference — it is a fundamentally different latency class that makes real-time line-speed inspection possible.
| Approach | Inference Latency | Network Dependency | Cost at Scale |
|---|---|---|---|
| Cloud inference (API) | 300–400ms | Hard dependency | High — every frame billed |
| Edge inference (ONNX) | ~9ms | None for primary decision | Low — compute is local |
| Edge inference (TensorRT FP16) | ~4.5ms | None | Low — optimized for device |
The business decision: Production lines do not pause for network issues. Edge inference removes the network from the critical path for the primary quality decision. Cloud connectivity is required for analytics, alerting, and model updates — but not for the inspection itself.
Decision 2: Why YOLOv11n Over Larger Model Variants?
We benchmarked three YOLOv11 variants during model selection:
- YOLOv11n (nano): mAP@50 of 0.91 after fine-tuning, 9ms inference latency on Jetson AGX Orin
- YOLOv11s (small): mAP@50 of 0.94, 21ms inference latency
- YOLOv11m (medium): mAP@50 of 0.96, 38ms inference latency
The 3–5 percentage point accuracy improvement from larger models was real but insufficient to justify the latency trade-off. At 5 units per minute, 21ms is already marginal headroom. At 38ms, the model cannot keep pace with line speed at all production rates. YOLOv11n at 9ms gives 20× headroom over cycle time — sufficient buffer for device temperature variation, I/O overhead, and future production rate increases.
The business decision: Accuracy matters, but availability matters more. A model with 91% mAP that runs reliably at every production rate is more valuable than a 96% mAP model that creates line stoppages during rate increases.
Decision 3: Why DynamoDB Over RDS for Defect Metadata?
The defect metadata workload is write-intensive: at 72,000 inspections per day across three production lines, the system generates sustained write throughput with short burst peaks during production starts and end-of-line inspections.
We evaluated Aurora PostgreSQL first, given the team's familiarity with SQL. The decision shifted to DynamoDB for three specific reasons:
- Burst write handling without connection pooling — RDS connection pools become a bottleneck under burst write conditions. DynamoDB on-demand capacity handles burst transparently without connection management overhead.
- Access patterns were well-defined — The three primary query patterns (by product unit, by station + time range, by shift + defect class) mapped cleanly to a single-table design with two GSIs. No ad-hoc joins were required.
- TTL-based retention — Compliance required one-year defect record retention followed by automatic deletion. DynamoDB's native TTL feature handles this without a separate archival job.
The business decision: DynamoDB's operational simplicity at the write volumes this workload generates outweighed Aurora's query flexibility for access patterns that are well-understood in advance.
Implementation Pattern
YOLOv11 Model Training: Dataset and Configuration
Model training was the most labor-intensive phase of the project. The dataset comprised 11,400 labeled images across six defect classes: missing fastener, misaligned bracket, incorrect cable routing, surface scratch, incomplete weld, and foreign object presence. Annotation was performed in CVAT with double-blind review by quality engineers to ensure label consistency across inspectors.
from ultralytics import YOLO

# Fine-tune YOLOv11n on defect dataset
model = YOLO("yolo11n.pt")  # COCO-pretrained base weights

results = model.train(
    data="defect_dataset.yaml",    # Class names, train/val/test paths
    epochs=100,
    imgsz=640,
    batch=16,
    device="cuda:0",               # NVIDIA Jetson AGX Orin (2048 CUDA cores)
    optimizer="AdamW",
    lr0=0.001,
    lrf=0.01,
    momentum=0.937,
    weight_decay=0.0005,
    augment=True,
    patience=15,                   # Early stopping — critical for small defect classes
    cos_lr=True,                   # Cosine LR decay — more stable fine-tuning
    project="quality_inspection",
    name="yolov11_defect_v3",
    save=True,
    val=True
)

# Export to ONNX for runtime-agnostic edge deployment
model.export(format="onnx", dynamic=True, simplify=True)
Model performance after fine-tuning:
| Metric | COCO Pretrained Only | Fine-tuned v3 |
|---|---|---|
| mAP@50 | 0.58 | 0.91 |
| mAP@50-95 | 0.39 | 0.77 |
| Precision | 0.71 | 0.93 |
| Recall | 0.65 | 0.90 |
| Inference latency (Jetson AGX Orin, ONNX) | ~6ms | ~9ms |
Data augmentation — horizontal flip, brightness jitter (±20%), random rotation (±5°), and mosaic augmentation — was essential for handling ambient lighting variation across three production shifts. Without augmentation, the model performed well under optimal lighting and poorly in early morning conditions when production lighting takes time to stabilize.
Secure IoT Ingestion: MQTT Topic Design
manufacturing/{plant_id}/line/{line_id}/station/{station_id}/inspection
manufacturing/{plant_id}/line/{line_id}/station/{station_id}/camera/health
manufacturing/{plant_id}/alerts/defects
Each inspection event published to IoT Core:
{
  "event_id": "insp-20241118-STN12-04231",
  "timestamp": "2024-11-18T08:43:17.823Z",
  "plant_id": "PLANT-MH-01",
  "line_id": "LINE-03",
  "station_id": "STN-12",
  "product_id": "PROD-VAR-B-00892",
  "inspection_result": "FAIL",
  "defects": [
    {
      "class": "missing_fastener",
      "confidence": 0.91,
      "bounding_box": [412, 318, 56, 48]
    }
  ],
  "model_version": "yolov11_defect_v3",
  "inference_latency_ms": 9,
  "image_s3_key": "inspections/2024/11/18/LINE-03/STN-12/insp-04231.jpg"
}
IoT device policies enforced least-privilege — each edge device could publish only to its own station topic hierarchy, preventing cross-station data injection. IoT Core rules engine routed all events to Kinesis Data Firehose for S3 delivery, FAIL events additionally to Lambda for DynamoDB write and SNS alert, and camera health events to CloudWatch metrics.
DynamoDB Single-Table Design
import boto3
from datetime import datetime

dynamodb = boto3.resource("dynamodb", region_name="ap-south-1")
table = dynamodb.Table("QualityInspectionEvents")

def record_defect(event: dict):
    table.put_item(
        Item={
            # PK/SK: lookup by product unit for traceability report
            "PK": f"PRODUCT#{event['product_id']}",
            "SK": f"INSPECTION#{event['timestamp']}",

            # GSI-1: station + time range for root cause analysis
            "GSI1PK": f"STATION#{event['station_id']}",
            "GSI1SK": event["timestamp"],

            # GSI-2: shift + defect class for quality dashboard aggregation
            "GSI2PK": f"SHIFT#{event['shift_id']}",
            "GSI2SK": f"CLASS#{event['defects'][0]['class']}",

            "inspection_result": event["inspection_result"],
            "defects": event["defects"],
            "model_version": event["model_version"],
            "image_s3_key": event["image_s3_key"],
            "plant_id": event["plant_id"],
            "line_id": event["line_id"],
            "ttl": int(datetime.now().timestamp()) + (365 * 24 * 3600)
        }
    )
Generative AI Interpretation: Bedrock on FAIL Events Only
Traditional computer vision tells plant supervisors what was detected. Amazon Bedrock tells them what to do about it.
We integrated Bedrock only for FAIL inspection events — approximately 14% of total volume. This keeps Bedrock spend proportional to business value: a PASS result requires no natural language explanation.
Example: a missing fastener detection at Station 12 produces the following Bedrock output:
"Fastener A missing at Station 12 (confidence 91%). Pattern matches three prior events on LINE-03 this shift — likely feeder misalignment rather than isolated miss. Recommend pausing LINE-03 for feeder inspection before producing additional units on Variant B."
That recommendation was not possible from computer vision output alone. It requires correlating the current detection against the session history — which is passed as context in the Bedrock prompt — to surface the pattern rather than the isolated event.
CI/CD Pipeline: OTA Model Deployment to Edge
S3 (new labeled defect images, threshold: 500+ new records)
    → EventBridge rule
    → CodePipeline triggered
        → CodeBuild: validate labels, merge with training set
        → CodeBuild: fine-tune YOLOv11n (100 epochs, ~45 min on ml.g4dn.xlarge spot)
        → Quality gate: mAP@50 ≥ 0.88
            → FAIL: SNS alert to ML team, pipeline stops
            → PASS: export ONNX, build Docker image
        → ECR: push versioned image (e.g., yolov11-defect:v4.1)
        → IoT Greengrass: create new component version
        → Canary: deploy to 2 of 12 edge devices, monitor 30 minutes
            → Drift detected: auto-rollback to previous ECR tag
            → Healthy: rolling update to remaining 10 devices
End-to-end from data trigger to full fleet update: approximately 3.5 hours. This replaced a manual process where model updates required SSH access to edge devices and happened quarterly at best — meaning newly introduced product variants ran uninspected on existing models for weeks before anyone noticed the accuracy degradation.
Cost Architecture and AWS Infrastructure Spend
At steady-state processing approximately 72,000 inspections per day (three production lines, single-shift, 20 working days per month):
| Service | Usage | Estimated Monthly Cost |
|---|---|---|
| AWS IoT Core | ~1.44M messages/month at $1.00/M | ~$1.44 |
| Kinesis Data Firehose | ~14 GB/month ingested | ~$4 |
| Amazon S3 | ~2.2 TB stored (inspection images + data lake) | ~$51 |
| Amazon DynamoDB | ~1.44M writes/day on-demand at $0.625/M WRU | ~$27 |
| Amazon Bedrock (Claude 3 Sonnet) | ~10,000 FAIL events/month, avg 600 input + 300 output tokens | ~$63 |
| Amazon SNS | ~12K alerts/month | ~$1 |
| AWS Lambda | ~2.4M invocations/month, 256MB memory | ~$9 |
| CodePipeline + ECR | 2 pipelines, ~20 GB image storage | ~$18 |
| IoT Greengrass | 12 core devices | ~$18 |
| CloudWatch + CloudTrail | Custom metrics, log ingestion, audit | ~$34 |
| Total | ~$226/month |
If Bedrock had been invoked on every inspection event rather than FAIL events only, monthly Bedrock spend would increase to approximately $450/month with no incremental business value. Filtering at the Lambda routing layer keeps GenAI spend proportional to actual need.
Against the approximately 35% reduction in quality-related costs — warranty claims, rework labour, and OEM penalty charges — the AWS infrastructure at approximately ₹19,000 per month is a rounding error on the ROI calculation.
Common Pitfalls (Real Lessons)
| Pitfall | What Happened | How We Fixed It |
|---|---|---|
| Model trained on controlled lighting images only | Accuracy dropped to 74% on night shift | Added brightness jitter and shift-stratified dataset sampling |
| IoT Core message size exceeded 128KB limit | Large image metadata payloads failed silently | Moved image to S3 first, sent only S3 key in MQTT payload |
| Greengrass deployment without canary stage | A broken model update halted inspection on all 12 devices simultaneously | Added 2-device canary with 30-minute observation window before fleet rollout |
| Bedrock called synchronously in Lambda | FAIL events during production bursts created queue backlog | Moved to async Lambda invocation with SQS buffer for Bedrock calls |
These emerged in production, not in testing. Documenting them in your runbook before they repeat is the operational habit that separates mature ML systems from perpetual firefighting.
Business Outcomes
| Metric | Before | After | Business Impact |
|---|---|---|---|
| Inspection accuracy | 82% | 97% | Defect escape rate reduced significantly |
| Inspection coverage | Sample-based | 100% of units | Full traceability per unit |
| Quality-related costs | Baseline | ~35% reduction | Warranty and rework savings |
| Defect detection speed | End-of-shift report | Real-time (<180ms per unit) | Prevents batch-level failures |
| Audit traceability | Manual, incomplete | Full digital record per unit | OEM compliance confidence |
| Inspector redeployment | 100% on line inspection | Shifted to quality analysis | Higher-value work per head |
The most significant shift was not the accuracy improvement — it was the move from reactive to preventive quality management. Under the manual system, defect patterns were visible only after they had produced a batch of defective units. Under the AI system, a pattern forming at Station 12 across 8 units in a 30-minute window triggers an alert before it becomes a batch failure. That early warning capability is the real value of real-time inspection — and it was not possible without structured, timestamped, per-unit data at production speed.
Lessons for Technology Leaders
- Edge inference is not optional for production-speed applications — Cloud inference introduces latency and network dependency that manufacturing environments cannot accept. The decision between edge and cloud is not a preference — it is a function of cycle time requirements. Measure your cycle time before you choose your inference architecture.
- Model selection is a latency decision, not an accuracy decision — The difference between YOLOv11n and YOLOv11s in accuracy is 3 percentage points. The difference in latency is 12ms. At production scale, the latency gap closes the conversation. Start with the latency constraint and work backwards to the model.
- GenAI enhances CV outputs — it doesn't replace structured data — The Bedrock recommendations that resonated most with the quality team were the ones that correlated current detections against session history. That correlation requires structured, queryable defect data in DynamoDB. GenAI without a data layer is a demo. GenAI with a data layer is a tool.
- OTA deployment is an operational requirement, not a feature — A model that cannot be updated remotely will degrade silently as product variants change and lighting conditions shift. Build the OTA pipeline before the first production model deployment, not after you've experienced the first degradation incident.
- Model governance is a compliance requirement in regulated manufacturing — Per-unit model version logging, automated rollback, and quarterly review processes are not engineering overhead — they are the audit evidence that quality leadership and OEM customers need to trust AI-driven pass/fail decisions.
About the Author
Chandni Gadhvi is Program Manager – Data and AI at AeonX Digital Technology Limited, where she leads the architecture and delivery of cloud-native AI and computer vision solutions for industrial enterprises. She specializes in edge-to-cloud AI systems on AWS that convert real-time operational data into quality intelligence. She is an advocate for practical AI deployment in manufacturing and shares technical thought leadership to help engineering teams move from proof-of-concept to production-grade systems on AWS.


